
 Available in US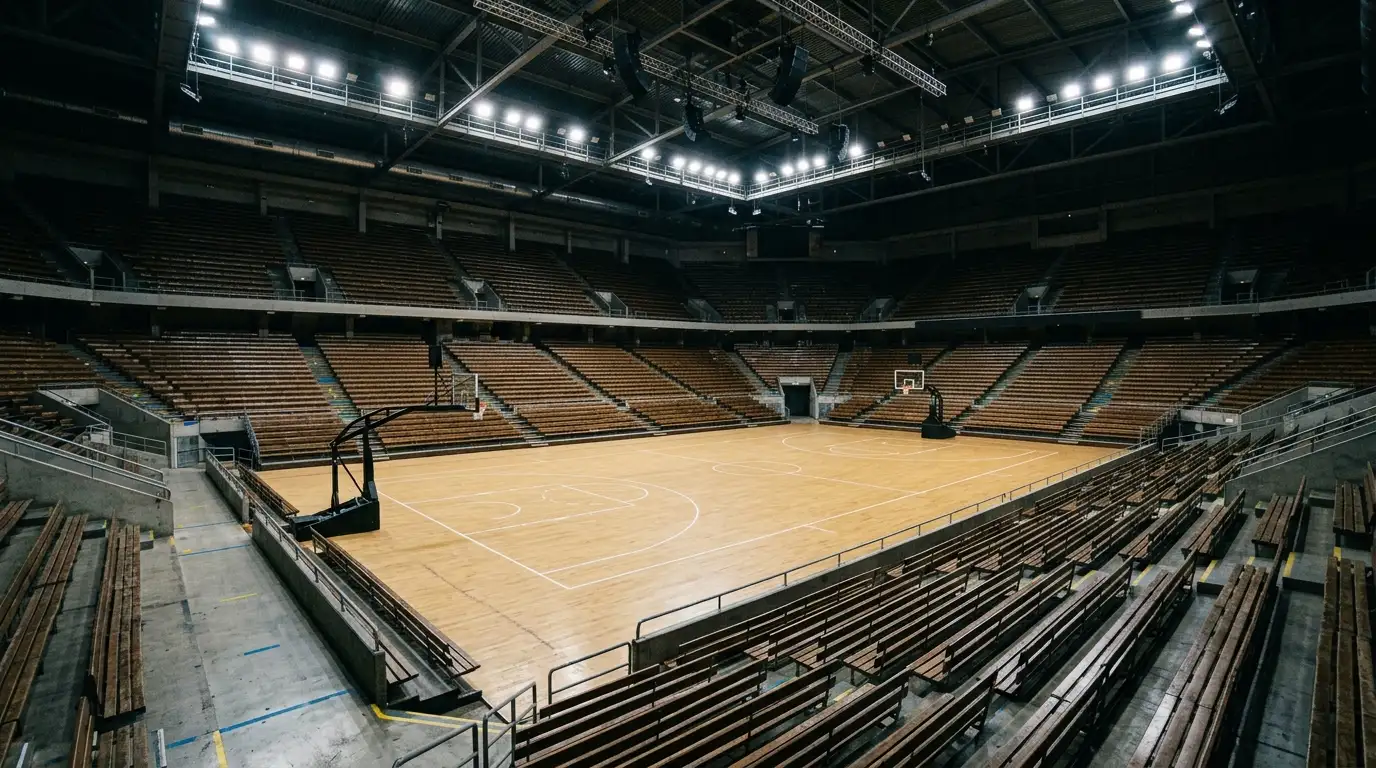
- Empty Arena Statistics – Crowd Pressure vs Referee Decision Models
- What home court advantage actually means in the data
- The Foster home-record file and what it adds
- The crowd-mediated mechanism that the data supports
- The Belasen 2025 finding and how it maps onto crowd context
- The UK angle and how the markets have adjusted
- The post-bubble pricing inefficiency that still persists
- The judgement call on chief assignment and crowd density
Empty Arena Statistics – Crowd Pressure vs Referee Decision Models
For decades, the debate over whether NBA referees were influenced by home crowds ran into the same wall. You could correlate home-team foul rates with crowd size, attendance percentage, or arena loudness, but you could never run a clean experiment because every game had fans. Then 2020 arrived. The COVID bubble, the empty-arena restarts, the partially-attended early 2020-21 season – for the first time in modern NBA history, the league played hundreds of games with the crowd variable set to zero or close to it. If home court advantage was substantially a referee effect, we would see it shrink. If it was substantially a player effect, we would see it persist.
What actually happened was more interesting than either of those clean answers. I have been working with the natural-experiment data from that period since it became available, and the conclusions I draw differ in important ways from the takes you will read in mainstream coverage. The crowd matters. The crowd matters less than people think. And the crowd matters in specific ways that map onto specific betting markets in patterns the closing line has still not fully absorbed five years later.
What home court advantage actually means in the data
Home court advantage in NBA betting has historically been priced at roughly two and a half to three points on the spread. That number has come down from the four-point figure that was conventional in the 1990s and early 2000s, partly because travel logistics have improved, partly because the broadcast and analytics environment has reduced the information edge home teams used to enjoy, and partly because the league has actively pushed officiating uniformity in ways that compress the referee component of the advantage.
The decomposition of the historic three-point home-court premium is roughly as follows. Travel fatigue and circadian disruption account for around one point. Familiar shooting backgrounds, rim depth perception, and floor familiarity account for another half-point. The referee-driven component – the share of home-team advantage attributable specifically to whistle patterns – accounts for the remaining point to point and a half. That is the contested chunk, and it is where the empty-arena natural experiment provides actual evidence.
The Pelechrinis paper published in Nature Scientific Reports in 2023 analysed 7,498 personal foul calls reviewed in NBA Last Two Minute reports across multiple seasons, including the 2019-20 bubble period and the 2020-21 partially-attended season. The finding was clean. Persistent home bias in personal foul calls was detected across the full sample, but the magnitude of the bias was notably smaller in games with reduced or zero attendance. The bias did not vanish entirely, which means it is not purely a crowd effect, but the gap between full and empty arenas was statistically significant.
The Foster home-record file and what it adds
Scott Foster’s 2023-24 home record sits at 39.6 per cent home wins on his assignments, with a 21-32-1 against the spread mark from a home-favourite perspective. As crew chief in his 2023-24 sample, the underlying home wins ran at 68.3 per cent with a margin differential of plus 7.7 points and a 36-26 against the spread record on home favourites. The contradiction between those two figures is instructive – Foster as one of three crew members produces a different home-team result than Foster as the crew chief setting the tone for replay reviews and ambiguous late-game calls.
Working that pattern back from the bubble data gives you a usable framework. The chief slot is where the crowd-influence channel is concentrated, because the chief handles replay decisions, signals last calls, and sets the override structure on contested fouls. The two non-chief officials produce more uniform calling patterns regardless of arena context. The implication is that home court advantage in the referee channel runs disproportionately through chief identity rather than through the crew as a whole, and chief identity is the variable most worth tracking from a betting perspective.
The crowd-mediated mechanism that the data supports
The mechanism by which crowds appear to influence referees is not the cartoon version where the official consciously responds to fan booing on a specific call. The mechanism is subtler and operates below conscious decision-making. Crowd noise produces an attentional load that affects how officials process ambiguous contact in the half-second between contact and whistle. The closer the call, the larger the attentional-load effect. Clear fouls – flagrant contact, obvious blocking calls – are unaffected. Marginal contact at the edge of the rulebook produces the directional bias.
That mechanism is consistent with the bubble data. The bubble games saw home win rates drop from the typical sixty per cent to fifty per cent, a ten-percentage-point swing. The reduction in home-team free-throw differential during that period was roughly two attempts per game shifted away from the home team. Two attempts at the league-average conversion rate is one and a half points, which maps almost exactly onto the chunk of home court advantage I described earlier as the referee component. The arithmetic lines up.
The 2025-26 environment is different in one important respect from 2019-20. The integrity monitoring infrastructure is more aggressive. The training and grading systems for officials have been overhauled under the Monty McCutchen-led development programme. Some of the referee-driven home-court component that existed pre-bubble has been actively engineered out of the calling patterns through performance-based grading. The component that remains is the part the league has not yet figured out how to coach away.
The Belasen 2025 finding and how it maps onto crowd context
The Belasen paper in the Journal of Sports Economics analysed Last Two Minute report data and found that in games with narrow betting spreads, referees made 23 per cent fewer wrong calls against road underdogs than against road favourites. That bias is a road-team-direction signal, which is to say it works the opposite way from the home-crowd-mediated effect I have been describing. The road favourites in narrow-spread games are the teams getting the worse calls.
The reconciliation between these two findings is critical for any modelling work. The home crowd produces a directional bias toward fewer fouls on the home team across all games. The Belasen signal produces a road-team disadvantage specifically on narrow spreads. The two effects are independent inputs, and they combine differently depending on the matchup structure. A narrow-spread game with a road favourite is the situation where both biases align against the road team and the closing line will systematically underestimate the home-team scoring premium. A wide-spread game with a road favourite sees only the home-crowd component active, and the closing line will price that one reasonably well.
For a UK punter working the spread market, the actionable insight is that home court advantage is not a constant. It varies with spread structure, crowd context, and crew chief identity. The historic three-point figure is the average. The bet-relevant figure is the matchup-specific value, which can run anywhere from one and a half points to four and a half points depending on which combination of inputs you draw.
The UK angle and how the markets have adjusted
UK bookmakers have been slower than US operators to incorporate variable home court advantage into their spread pricing. Part of that is volume – the UK NBA market is small enough that the modelling effort to refine pricing past the major variables is not always cost-effective. Part of it is structural – UK books mirror US pricing as a default, and adjustments to the underlying US line are conservative. The practical effect is that the actionable edge on variable home court advantage tends to be cleaner on UK coupons than on the same games priced through US sportsbooks.
The Q1 2025 figure on UK adult online sports betting participation sits at 8 per cent of the population, with football at 6 per cent and basketball as part of the residual category. The scale of NBA betting on UK coupons is therefore small relative to football, which is part of why pricing receives less analyst attention from operator trading desks. That asymmetry is the structural reason why referee-driven edges have survived longer on UK NBA markets than on UK football markets. The volume is not there to incentivise the pricing precision.
The specific UK markets where the home court advantage gradient matters most are the spread, the moneyline on home dogs in close matchups, and the team-total-points markets. Each responds differently to crew chief identity. The deeper analysis of how individual referee patterns produce statistical biases that betting models can measure runs through the NBA referee race bias study piece, which works through the foundational Price and Wolfers methodology that all of this analysis ultimately builds on.
The post-bubble pricing inefficiency that still persists
Five seasons on from the bubble, the closing-line treatment of home court advantage has tightened but not converged. US operators have built variable-HCA models that price the chief identity, the crowd context, and the matchup-specific spread structure with reasonable precision. The UK side of the market is one to two steps behind, partly because volume does not support the modelling investment, and partly because the variables that drive the variation are not on UK trading-desk dashboards in the same way.
That gap is where the edge sits for a UK punter willing to do the work. The chief identity is publicly available the afternoon of game day. The matchup structure – spread width, favourite identity, attendance projection – is also public. Combining those inputs into a refined HCA estimate is a spreadsheet exercise, not a quant exercise. The bettors I have worked with who have actually made money on this signal have done so by spending an hour the afternoon of each slate on this specific question, rather than by building elaborate predictive models. The edge is in the inputs, not in the modelling sophistication.
The judgement call on chief assignment and crowd density
Home court advantage is real. It is partly a referee phenomenon. The referee component is smaller than the cartoon version suggests, larger than the strict league position acknowledges, and concentrated in the chief slot in ways that make it more tractable to model than the crew-level averages would imply. Crowd density is one of the inputs that produces the variation. Spread structure is another. Chief identity is the third.
The bettors who consistently make money on home-team spread bets are not the ones who blindly back home favourites. They are the ones who can identify, before the line is set, which specific matchup combinations produce a larger-than-priced home-court premium. That identification process is one of the cleaner ways to deploy referee data in NBA betting, and the empty-arena natural experiment from 2020-21 is what gave us the cleanest data set we will ever have for calibrating it. The natural experiment cannot be re-run. The pricing implications of what we learned from it have not yet been fully absorbed.
Articles
Created by the "nbarefbettin" editorial team.
